| |
Documents |
|
|
CURRENT NEWS |
|
CASE NARRATIVES |
|
ENVIRONMENTAL EXPOSURE REPORTS |
|
HELP FOR VETERANS |
|
|
||||
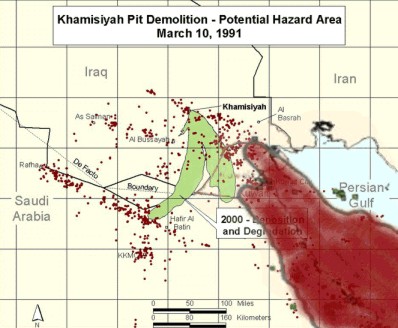
Khamisiyah Demolition model falsehoods
- Here is what everyone has been waiting to see, the actual
- CIA satellite image from March 1991 that shows a easterly
- flow rather than southerly as outlined in the OSAGWI
- model.
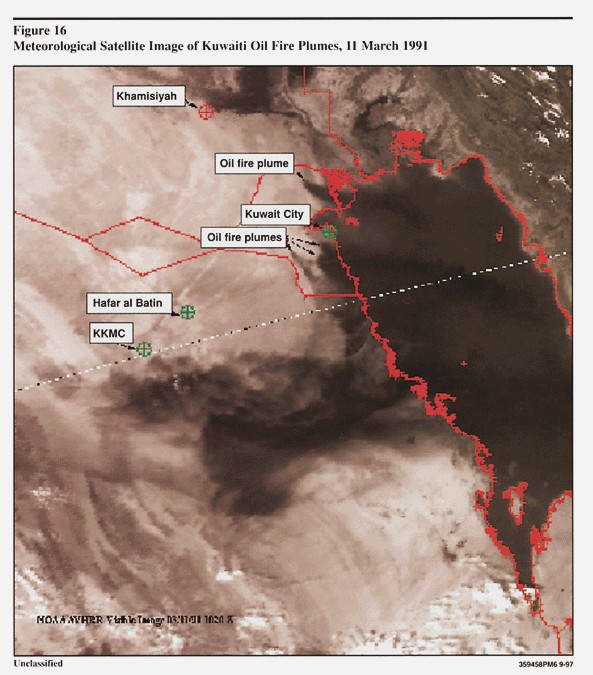
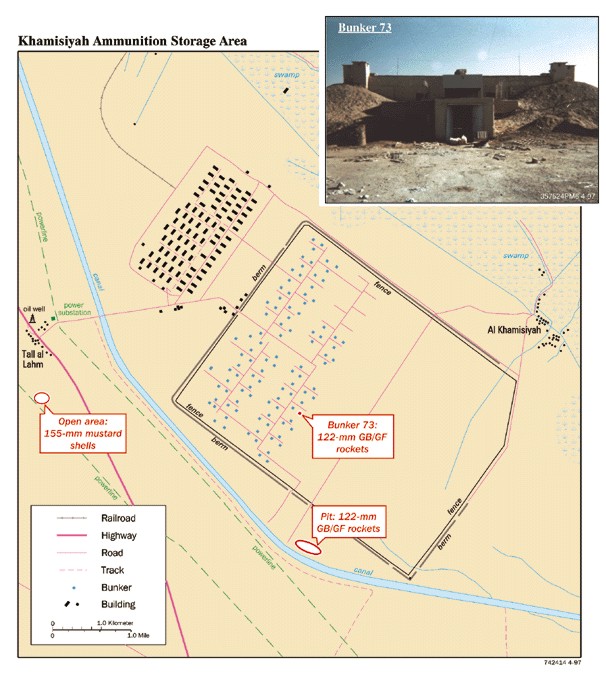
- In this CIA image from the Khamisiyah pit, you see that smoke
- scarring on the ground is also easterly rather than just southerly.
- The CIA graphics are deliberately released in low resolution so
- that outside interpretation is limited. The bulk of the gray shadows
- are right of the dark blast pits, instead of all downward.
- This is the PowerPoint presentation I gave to the RAC on September
- 20th 2005, with attached satellite animation of Shamal trade winds in action. I explained this is all RAW data of my intended 3D rendering
- of the plume once I get the high altitude data for March 1991. http://www.gulflink.org/fallout/RACPresentation.ppt
- By shifting the OSAGWI model to match terrain and wind direction
- from point of origin, you see a subtle change in exposures. The goal
- had been to show that the winds carried the smoke over most of VII
- Corp, definitely 1st and 3rd Armored, and troops in Kuwait City.
- The first three military models carefully placed the plume between
- most of the troops rather than across them as the normal weather
- patterns would have showed.
The DHSD 1991 Gulf War Khamisiyah demolition models- contradicted the normal trade winds of the Iraqi southern
- terrain. I argued this profusely with DHSD, and with many
- to include GAO who still has my display. Now with the
- CHPPM's Oil Well Fire Super Plume data, the argument
- becomes more clear.
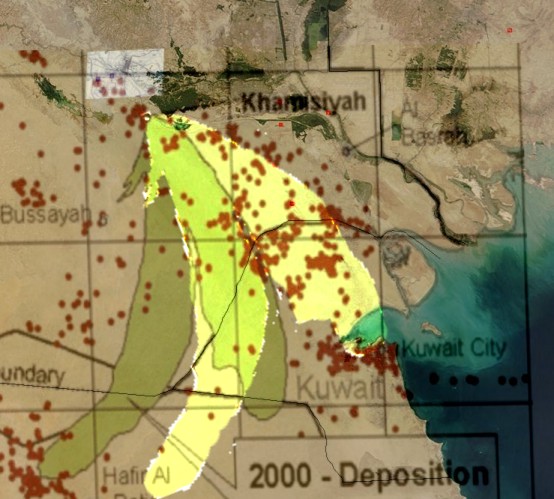
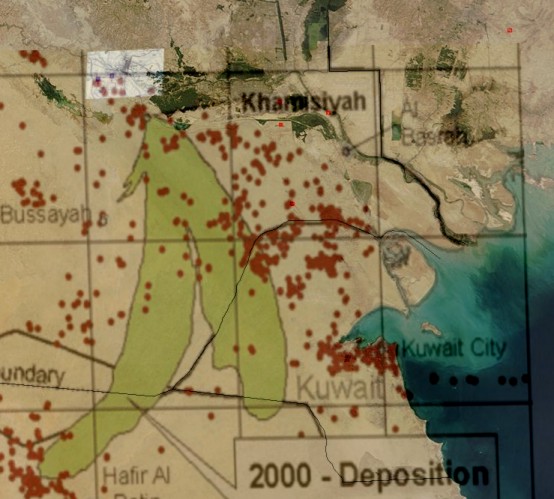
Well, I took the relief map from CHPPM'S Oil Well fires- super plumeĀand matched the overlay to the DHSD
- Khamisiyah model. The location of Kuwait border,
- Persian Gulf Beach line were my scale references for
- merging the two images. I then made the CHPPM'S map
- semi opaque, and applied to the DHSD map. Afterwards
- I then took the smoke outline and filled it in the super
- plume boundary.
- http://www.gulflink.osd.mil/owf_ii/fig12.htm
As you see the from the super plume boundary, the- DHSD model avoids natural wind flow for the region to
- take a artificial turn away the 1st and 3rd AD locations.
- If the CHPPM'S plume is a accumulation of months of
- data, then this is a amalgamation of the trade winds of
- this region. Otherwise the smoke data would follow the
- other curvature at some point and covered more of
- Saudi Arabia.
This is why DHSD refused to provide satellite images- in there Khamisiyah modeling report as it would conflict
- with its models. CHPPM's provides a brief image, and
- in it the wind patternsĀdo not match DHSD wind weather
- models.
- Well, turns out NASA would provide the helpful clues on
- the trade winds in Iraq. It only took 15 years to finally get
- satellite images in high resolution of Iraq, and the Modis
- Iraq subset had 29 days of sequential images to pull from.
- From August 10th to September 9th 2005.
- So the main demolition days in question was around
- March 10th 1991, keep in mind the terrain of Iraq guide
- these trade winds - so the August images wont be radically
- different from March. The winds are blocked by mountains
- of Iran to the northeast, and Iraqi valley features that flow down
- to the Persian Gulf. The video shows this is pretty constant.
- http://www.gulflink.org/fallout/aug05wind.avi
- Compressed version - 1.4mg
- http://www.gulflink.org/fallout/aug1020005wind.avi
- Full resolution version - 16.4 meg
- March 10th 1990 OSAGWI Plume model
- Proposed March 10th 1990 Plume Model
- These images had another added bonus, smoke markers
- in many locations above, and in Kuwait that showed wind
- direction that day. Only one day in 29 did the wind follow
- the path hinted at by DHSD in its models, and it didnt curve
- hard back into Saudi Arabia. Which would be odd as the
- area in the model flows up over a large valley shelf instead
- of the gentle slope to the ocean.
- If you follow the trade winds, it would put the fallout of the
- demolition over the concentration of 1st and 3rd AD units
- of 7th Corp in southern Iraq. As well as troops in Kuwait
- City. Not narrowly missing them like in the DOD models.
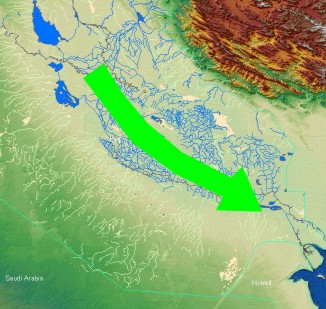
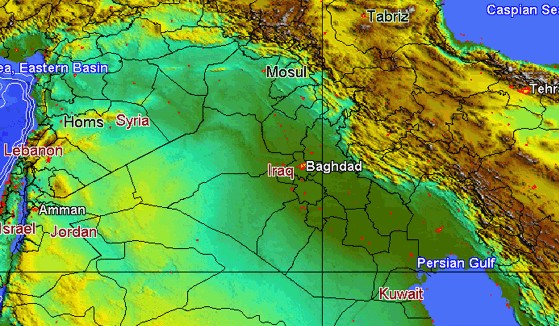
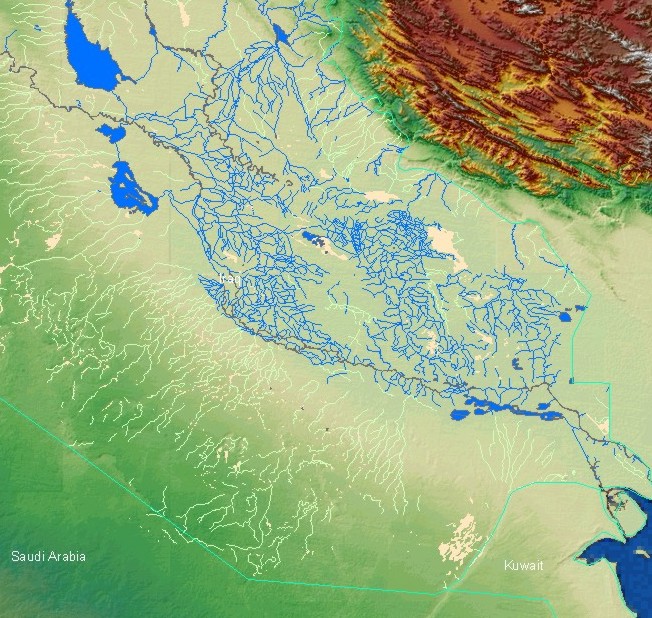
- Here are some more features of Iraq demonstrating the
- curvature of the valley as it wraps around the Iranian
- mountains. In the second image below this one you also
- see that the irrigation lines around the valley flow toward
- the rivers, which means a raised terrain feature that flows
- down from Saudi Arabia to the Euphrates in Iraq. Which
- further supports the time lapse satellite images of the winds
- general direction.